Our new blog is now integrated into our website so that all the charting and hydrographic surveying information you need is at your fingertips!
If you’ve already subscribed to our WordPress blog with your email address, you’ll continue to get email notifications of new blog posts. If you haven’t yet subscribed and would like to receive notifications, you can sign up on our new blog home page.
We are excited to continue to share informative and inspiring stories, updates, and news about Coast Survey.
While conducting hydrographic surveys at the request of the U.S. Coast Guard following Hurricane Florence, NOAA’s Office of Coast Surveynavigation response teams (NRT) identified hazardous obstructions in the Cape Fear River channel. Since these dangers to navigation will remain in place while the port reopens, NOAA updated its charts with the new hazards and distributed them to the port, Coast Guard, and key stakeholders. The time from the survey to the publication of the chart was less than 24 hours, an unprecedented accomplishment for Coast Survey.
“NOAA has streamlined all phases of our ping-to-chart process over the past 10 years,” remarked Rear Admiral Shepard Smith, the director of NOAA’s Office of Coast Survey, “this milestone results from dozens of technology, workflow, and distribution changes that have dramatically improved the level of service to the American public. We would not even have imagined doing this in the paper chart era. The most significant improvements have come in sonar integration, 3D GPS surveying, gridded bathymetry workflows, database-driven GIS-based cartography, and free internet chart distribution.”
Surveying for underwater hazards in the Carolinas
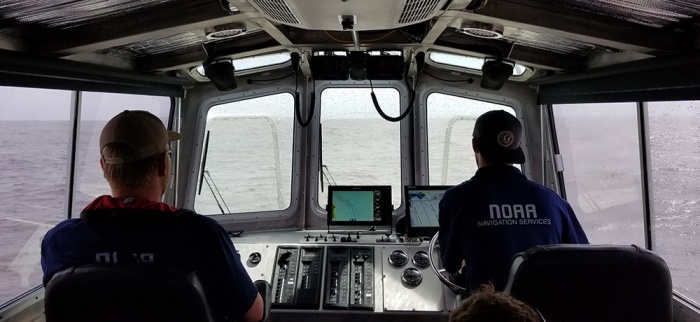
As Hurricane Florence made landfall as a Category 1 storm on September 14 near Wrightsville Beach on the North Carolina coast, Coast Survey’s navigation managers and response teams werepositioned and standing by, ready to conduct hydrographic surveys in the affected ports and waterways. As the storm passed through, requests from the Coast Guard and U.S. Army Corps of Engineers for survey assistance were received.
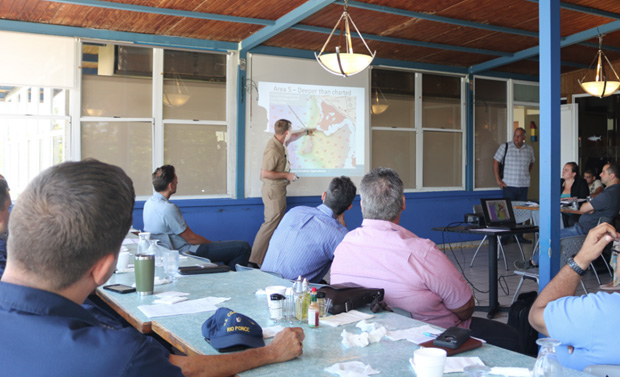
Lt. Cmdr. Wartick providing a brief-out on NOAA survey work and data analysis as part of the Coast Guard Maritime Transportation System Recovery Unit report to Coast Guard leadership.
Lt. Cmdr. Ryan Wartick, NOAA’s mid-Atlantic navigation manager, was embedded with the Coast Guard incident command post and Maritime Transportation System Recovery Unit team at Seymour Johnson U.S. Air Force Base in Goldsboro, North Carolina. With local Army Corps personnel affected by the hurricane, the team relied heavily on NOAA field units and their surveys to assist in the decision to reopen the ports of Morehead City and Wilmington.
The Port of Wilmington, located 26 miles up the Cape Fear River from the open sea, is a major Southern port that supports container, bulk, breakbulk, and roll-on roll-off operations. The Coast Guard Captain of the Port closed the Port of Wilmington in advance of the hurricane and considered restoring navigation to the port urgent. Commerce coming into the port directly supports the local community with jobs, food, fuel, and other products. The local hospitals and the main water treatment plant were running off generator power with fuel supplies running low.
NOAA’s NRT stationed in Fernandina Beach, Florida, traveled to Wilmington and coordinated with the Army Corps to survey the Cape Fear River. The team collected side scan sonar and multibeam echo sounder data to junction with NOAA Ship Ferdinand R. Hassler‘s survey data of the approaches to Cape Fear River. The team worked around the clock – on the water all day and processing the data overnight – to provide the Coast Guard with the condition surveys of the approach, channel, and critical terminals. The team found four underwater hazards and anticipates more hazards may be found as surveying continues. The surveys allowed a fuel barge to enter Wilmington to re-fuel the local hospital and water facility to keep them running.
James Kirkpatrick, team lead of NRT – Fernandina Beach, surveys the Cape Fear River following Hurricane Florence.NOAA Ship Ferdinand R. Hassler surveys the approaches to Cape Fear River, North Carolina.One of the four objects detected in Cape Fear River by NOAA’s navigation response team and reported to the Coast Guard on September 17, 2018. (Note: chartlet not for navigation)
The Port of Morehead City is located four miles from the Atlantic Ocean and lies within 700 miles of 70% of the U.S. industrial base. NOAA’s NRT stationed in New London, Connecticut, traveled to Coast Guard Station Morehead City to survey the port at the request of the Coast Guard Captain of the Port. The team completed survey work on September 18, processed the data, and delivered their results to the Coast Guard. The team verified no obstructions needed removal prior to reopening the port, supporting the Coast Guard decision to allow their vessels to navigate the waterway.
Eli Smith, Lt. j.g. Dylan Kosten, Lt. j.g. Matt Sharr of NRT – New London, survey the Port of Morehead City following Hurricane Florence.Multibeam echo sounder data of the Port of Morehead City collected by NOAA’s navigation response team and reported to the Coast Guard on September 18, 2018. (Note: chartlet not for navigation)Coast Guard cutters Nathan Bruckenthal and Oak, relied on data collected by Coast Survey’s response team to enter port and moor.
NOAA’s mobile integrated survey team (MIST) surveyed Murrells Inlet, South Carolina, at the request of the U.S. Coast Guard using their TanB (trailerable aids to navigation boat) vessel. For this response, the MIST equipment included the autonomous surface vehicle, EchoBoat, equipped with side scan sonar and a multibeam echo sounder, and the REMUS 100 autonomous underwater vehicle. After completing work at Murrells Inlet, the team surveyed the Little River Inlet just south of the North Carolina border.
Charting underwater hazards to ensure immediate safe navigation
Coast Survey’s John Whiddon and Lance Roddy received the Cape Fear River hazard locations from the response team and registered them with the Nautical Data Branch. Cartographers Darien Watkins and Brian Martinez, added the hazards to the navigational chart and delivered an updated chart to the Coast Guard in under eight hours. This data supported the Coast Guard’s decision to reopen the Port of Wilmington. The updated chart will be released to the public on the afternoon of Thursday, September 20, three days after the hazards were discovered, as part of the regular weekly update cycle so all mariners can be notified as soon as possible.
Improving storm surge modeling to support public safety
Coast Survey is more than surveying, charting, and maritime response. The Coast Survey Development Lab provided storm surge modeling expertise to the National Hurricane Center in Miami, Florida, ahead of and following the hurricane. Dr. Sergey V. Vinogradov, storm surge modeling lead, provided visualizations of storm surge simulations using the Hurricane Surge On-demand Forecast System for each forecast cycle of Hurricane Florence. Hindcast simulations were performed following the storm, to validate the model performance. This work contributed to storm surge predictions and inundation information, ultimately supporting public safety.
National Hurricane Center briefs the Secretary of Commerce, Wilbur Ross (who is located remotely at the National Centers for Environmental Prediction), on storm surge projections on September 13, 2018.
By Cmdr. Chris van Westendorp, Commanding Officer of NOAA Ship Thomas Jefferson
Almost one year following the passage and destruction of Hurricane Maria, NOAA Ship Thomas Jefferson has returned to Puerto Rico. Following the storm, Thomas Jefferson deployed in September 2017 for hydrographic hurricane response work in Puerto Rico and the U.S. Virgin Islands (PR/USVI). The ship and crew surveyed 18 individual port facilities to ensure safety of navigation and help re-open the region for maritime commerce. Thomas Jefferson’s second major project of 2018 has brought the ship back to Puerto Rico from August to November, conducting follow-up survey work along the north and south coasts.
NOAA Ship Thomas Jefferson recovering hydrographic survey launch 2904 on September 7, 2018, in Bahia de Guayanilla, Puerto Rico. The vast majority of Thomas Jefferson’s 2017 and 2018 survey work in and around Puerto Rico was completed with the ship’s survey launches.
While anchored in Bahia de Guayanilla, Cmdr. Chris van Westendorp, commanding officer of Thomas Jefferson, was invited by the Puerto Rico South Coast pilots to speak at a South Coast Harbor Safety & Security Committee meeting in Salinas. Attended quarterly by area commercial, federal, and local maritime stakeholders, each meeting features presentations on a variety of topics such as harbor safety and preparedness, maritime security, and relevant oceanographic research (e.g. PR SeaGrant, PR Climate Change Commission).
Cmdr. van Westendorp presents preliminary survey results to the Puerto Rico South Coast Harbor Safety & Security Committee from Thomas Jefferson’s 2018 hydrographic survey project in San Juan, Ponce, and vicinities, Puerto Rico.
Several presentations discussed ongoing Hurricane Maria recovery efforts, and conversations with attendees emphasized that storm effects still permeate businesses and the island economy. The meeting also revealed the existence of strong interagency relationships in the group, reflective of South Coast culture. These connections enable close and effective collaboration of agencies such as NOAA, U.S. Coast Guard, U.S. Army Corps of Engineers, and SeaGrant, in supporting the region’s environmental resources, economy, and security, as well as forming improved hurricane preparedness and response plans.
Accompanied by Coast Survey Atlantic Hydrographic Branch’s Julia Wallace (ERT), Cmdr. van Westendorp presented on nautical hydrography, including an outline of the ship’s 2017 post-Maria work, as well as current project plans and preliminary results. During and after the presentation, attendees showed particular interest in survey results in and around Guayanilla, Ponce, Jobos, Las Mareas, and Yabucoa; port areas previously identified by the South Coast pilots as critical for local and island-wide economies alike. The Coast Guard Captain of the Port (based in San Juan) and his staff also engaged Cmdr. van Westendorp and Julia Wallace in conversations regarding the allocation and positioning of survey capabilities in preparation for major storm events in the PR/USVI region.
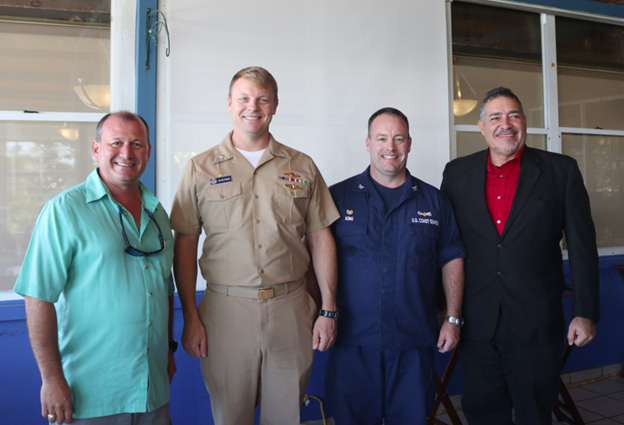
From left to right: Capt. Alex Cruz (South Coast pilot and vice chairman, South Coast Harbor Safety & Security Committee [SCHSSC]), Cmdr. Chris van Westendorp (commanding officer, Thomas Jefferson), Capt. Eric King (Coast Guard Sector San Juan Captain of the Port), Mr. Luis Torres (Chairman, SCHSSC)A year after the devastation of Maria, it is clear that Thomas Jefferson’s presence and ongoing work are gratefully received by and worthwhile to the people of Puerto Rico.
Hurricane Florence is due to make landfall on Friday morning, September 14, on the coast of North Carolina. While it creeps its way toward the East Coast, NOAA’s Office of Coast Survey is prepared to deploy its hydrographic survey assets to help speed the resumption of vessel traffic in our nation’s ports following the storm.
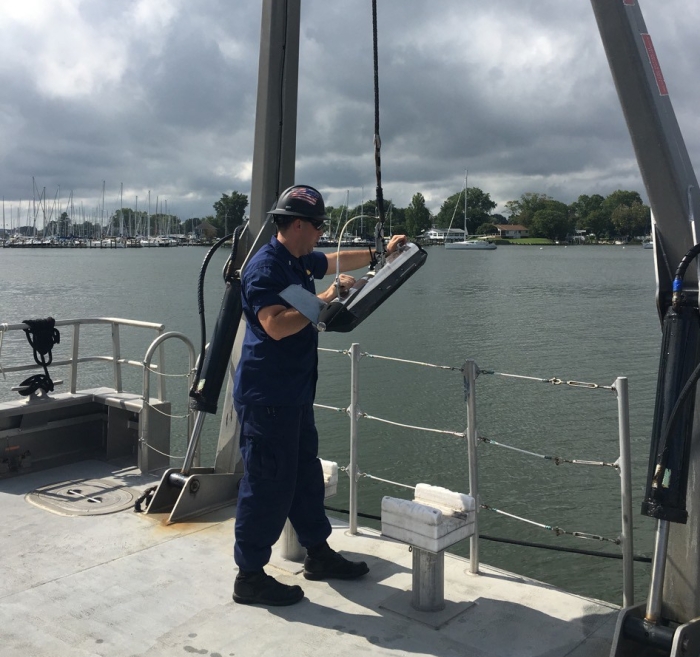
Lt. j.g. Patrick Debroisse, junior officer in charge of Bay Hydro II, deploys side scan sonar in Solomons, MD, for testing in anticipation of Hurricane Florence response.
NOAA’s southeast, Mid-Atlantic, and Chesapeake Bay navigation managers are coordinating with the U.S. Coast Guard (USCG) and U.S. Army Corps of Engineers, following their daily plans and keeping them informed of NOAA’s survey assets and their readiness. NOAA’s navigation response teams (NRT) are prepared for deployment depending on the track of the storm:
NRT stationed in Fernandina Beach, Florida, is standing by awaiting deployment
Bay Hydro II is standing by in Solomons, Maryland, awaiting deployment
NRT stationed in New London, Connecticut, will travel south this week to stage closer to impacted areas
NRTs stationed in Seattle and Galveston have personnel available to respond
Mobile integrated survey teams located in Washington, DC, and Stennis, MS, are prepared to respond
Coast Survey Development Lab storm surge modeling expert is embedded with the National Hurricane Center in Miami to assist with various modeling products as the storm approaches
Status of NOAA’s Office of Coast Survey response assets in preparation for Hurricane Florence.
In the wake of strong storms and hurricanes, large debris can become submerged, creating dangers to navigation. Ports are often closed until this debris can either be removed or determined not to be a threat. Coast Survey specializes in surveying the seafloor and reporting to the USCG the location, depth, and size of the debris. Once our teams notify the USCG of our findings, the quicker ports can re-open and resume shipping.
Visit nowCOAST™ for real-time coastal observations and forecasts related to Hurricane Florence.
Check back on our blog as we update the status of our response teams over the next week.
Starting in the Rocky Mountains of British Columbia, the Columbia River flows through Washington state and turns west to form the border of Washington and Oregon, serving as the largest river in the Pacific Northwest region.
The river and its tributaries are central to Pacific Northwest culture and the lifeblood of the regional economy. The Columbia River is the West Coast’s leader in foreign trade supporting 50 million tons of dry bulk, mineral bulk, wood, and auto imports and exports. It is also the nation’s leading wheat export gateway and second for corn and soybean exports.
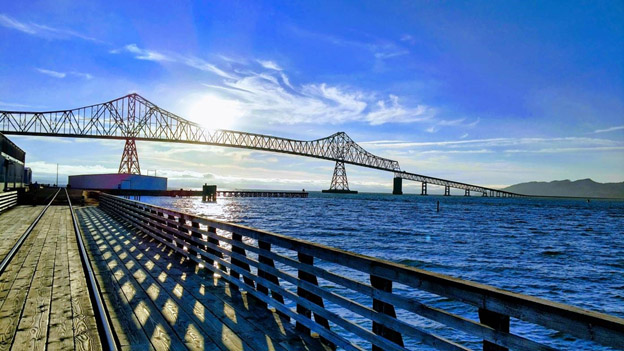
Astoria, Oregon, is situated where the mouth of the Columbia River meets the Pacific Ocean. Credit: Adam Argento
With an average flow at its mouth of about 265,000 cubic feet per second (Kammerer 2005), it is no wonder this dynamic river’s soundings (or depth measurements) are constantly changing. The last commissioned NOAA survey of the river was in 2009 and since then, the Columbia Snake River System is poised to handle more cargo than it has historically carried. Safe anchorage areas are critical and allow for ships to rest at sea securely while waiting to enter port. The anchorages that make up the river system serve as a vital component in the safe and efficient transport of goods.
Vessels safely navigate the river under the guidance of the Columbia River Pilots (COLRIP), an association of more than 40 professional mariners licensed by the state of Oregon to provide maritime pilotage service to all ports on the lower Columbia and Willamette rivers. The pilots are charged with safely providing vessels with extensive navigational experience, local knowledge, and ship handling skills in all weather conditions 24/7, 365 days a year.
In January 2018, COLRIP and the Columbia River Steamship Operators Association (CRSOA) met with Crescent Moegling, NOAA’s northwest and Pacific Islands navigation manager, to discuss survey priorities for the anchorages in the Columbia River. When examining anchorage priorities, COLRIP and CRSOA put careful consideration into safety, width for large vessels or depth for deeper vessels, locations, proximity to berths, anchor buoy locations, emergency anchor locations, and other such factors.
From there, the request to survey was sent to Coast Survey’s Navigational Response Branch (NRB) and assigned to navigation response team(NRT) 3, serving the Pacific Northwest.
Data collection on the Columbia River anchorage areas started in early June in Longview, Washington, with NRT3 team member Timothy Wilkinson and NRT2 team member (serving the South Atlantic region), Lucas Blass.
In the beginning of August, NRT3 returned to the Columbia River ready to survey with additional support from NOAA’s Pacific Hydrographic Branch Physical Scientist Adam Argento, and five members with two launches from NOAA Ship Rainier. The group started with the three anchorage areas at the mouth of the river, in Astoria, Oregon.
Rainier’s survey launches, flanking NRT3, as they begin work in the Columbia River. Credit: Lt. Cmdr. William Winner
While surveying, the group met unique challenges, such as large vessels anchored in the survey area. The team overcame this challenge by waiting for the tide to turn in the early afternoon, and for the ships to sway in on their anchor in the opposite direction. Numerous large vessels wait at anchor outside Astoria before heading into Portland or wait to cross the Columbia River Bar.
A survey launch gets close and personal with a large vessel at anchor during survey operations. Credit: Lt. Andrew Clos
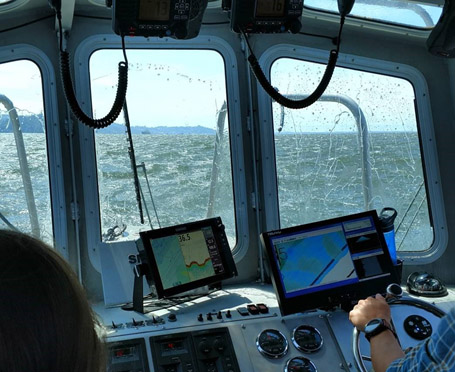
Known for its constantly changing conditions, the Columbia River Bar near Astoria can change from calm to dismal in five minutes as the direction of the wind, swell, and current vary significantly and can cause hazards to vessels. This proved to be a challenge as the team would experience placid seas in the morning, which would quickly turn to hazardous in the midafternoon.
NRT3 heads back into port after completing survey operations due to weather. Photo credit: Adam Argento
After a week of survey in Astoria, the group moved to Portland to continue surveying various anchorage areas, terminals, and industrial areas on the Columbia and Willamette rivers. Here, the group meet with the COLRIP and CRSOA for a day of surveying in the upper and lower Vancouver anchorage area.
So far, 656 square nautical miles of the Columbia River anchorages have been surveyed, with more to come in early fall. NOAA met constituent and stakeholder needs in a timely and efficient matter. Safe anchorage locations on the Columbia River increases safety and business, which has a positive impact on the local, regional, and national economy.
NRT3 thanks Shaver Transportation for providing moorage to NRT3 and the Rainier launches while in Portland.
HST Audrey Jeruald and HST Amanda Finn head out for crew training and qualification on NRT3 with Lt. j.g. Michelle Levano. Photo Credit: LT Andrew ClosAn overview of the anchorages surveyed on the Columbia River within the last year. NRT3 will head back to Oregon and Washington to survey on the remaining anchorages at a later date.